IDEKER LAB
University of California,San Diego
|
|||||
| HOME PEOPLE RESEARCH SOFTWARE PUBLICATIONS JOBS LINKS UCSD CONTACT | |||||
| Overview | Tables & data download | Figures: S1, S2, S3, S4, S5, S6, S7, S8 | Additional Figures: 1, 2, 3, 4, 5 | References | |
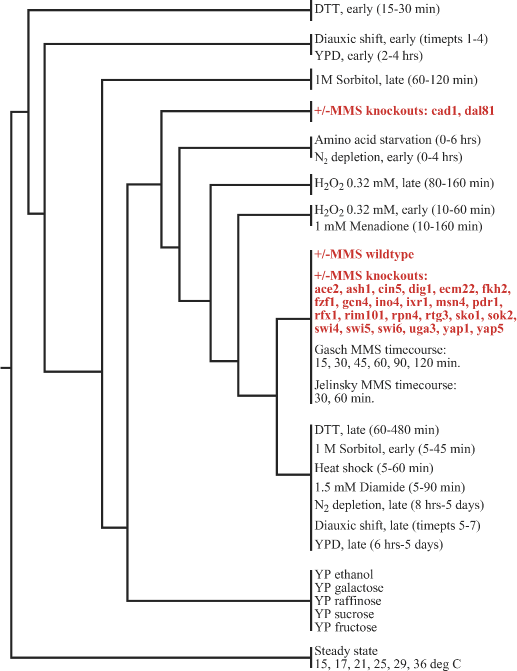
Figure S3. Clustering of MMS expression responses with other stresses. | |
|
Expression profiles generated in this study (wild type and TF knockouts +/- 0.03% MMS) were clustered together with previous expression data for MMS [Gasch et al. (ref S12) and Jelinsky et al. (ref S16)] and other environmental stresses (ref S17). Hierarchical clustering was performed using ClustArray to construct a dendrogram on the conditions. The dendrogram shows that the +/-MMS wild type profile from this study is in relative agreement with previous ones. Moreover, all but two (cad1Δ and dal81Δ) of the +/-MMS knockout profiles are more similar to the MMS wild type response than to other stress responses. |
|