IDEKER LAB
University of California,San Diego
|
|||||
| HOME PEOPLE RESEARCH SOFTWARE PUBLICATIONS JOBS LINKS UCSD CONTACT | |||||
| Overview | Tables & data download | Figures: S1, S2, S3, S4, S5, S6, S7, S8 | Additional Figures: 1, 2, 3, 4, 5 | References | |
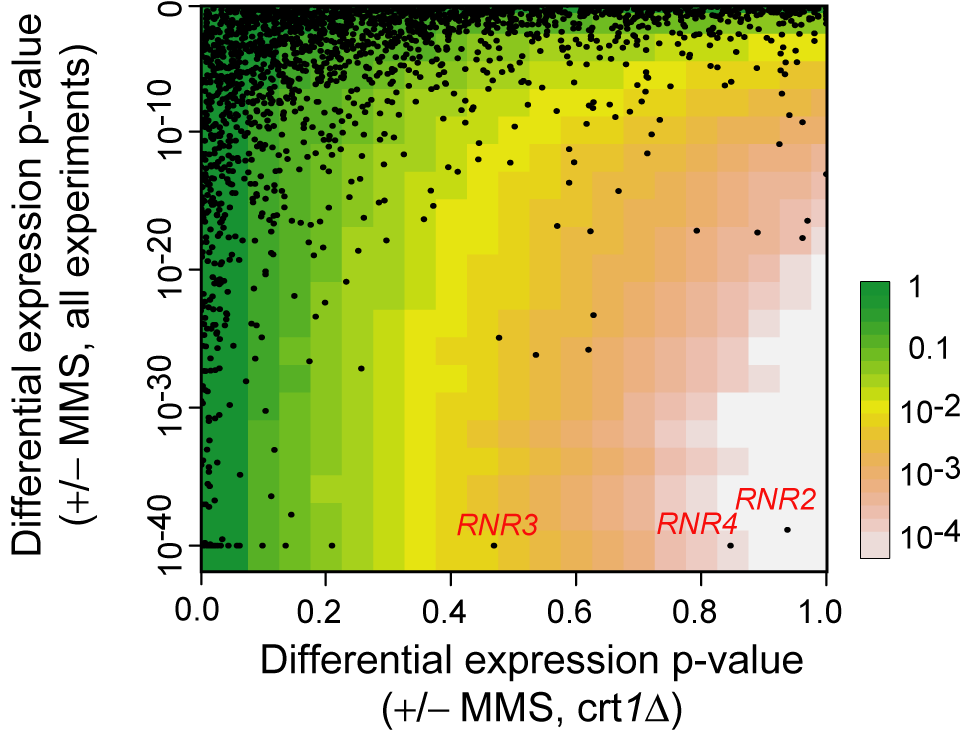
Figure S5. Crt1 deletion-buffering p-values | |
|
Crt1 deletion-buffering p-values (colors ranging from green to white) are computed for each gene (black points) based on their p-values of differential expression for crt1Δ (x-axis) versus all experiments (y-axis).
|
|