IDEKER LAB
University of California,San Diego
|
|||||
| HOME PEOPLE RESEARCH SOFTWARE PUBLICATIONS JOBS LINKS UCSD CONTACT | |||||
| Overview | Tables & data download | Figures: S1, S2, S3, S4, S5, S6, S7, S8 | Additional Figures: 1, 2, 3, 4, 5 | References | ||
Figure S7. Expression of RNR genes and their binding by Crt1p (Rfx1p) in the presence vs absence of MMS | ||
|
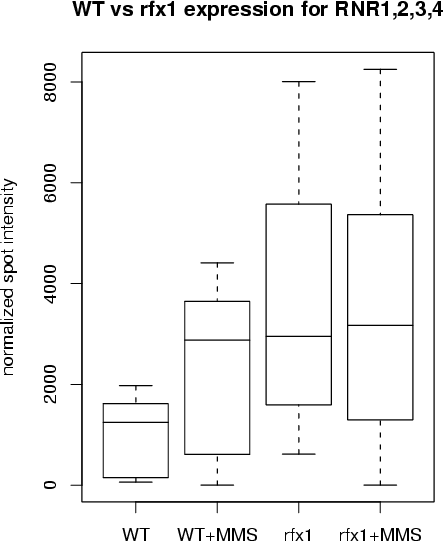
(A) Distributions of normalized spot intensities (cy3 and cy5 channels) for the four RNR genes in crt1Δ + vs. -MMS over four replicate microarrays (16 spot intensities for each distribution). The wild-type expression levels show an induction of these genes after exposure to MMS while the crt1Δ experiment shows constitutive expression for both + and -MMS.
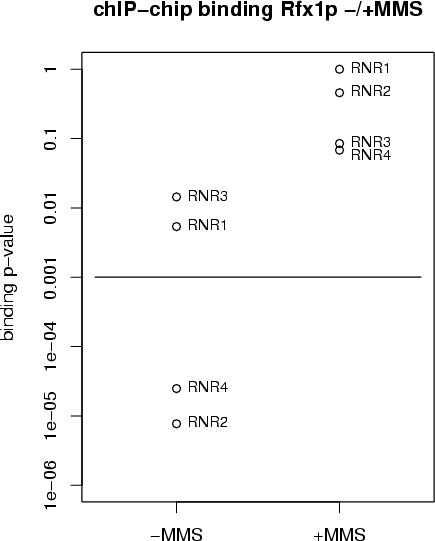
(B) The binding data show strong evidence for Crt1p binding upstream of RNR2,4 (and marginal evidence for RNR1,3) in nominal growth conditions while binding evidence suggests a lack of Crt1p binding for all RNR genes after exposure to MMS. These data support the induction (by derepression) observed in the first two distributions in (A).
|
A
|
B
|