IDEKER LAB
University of California,San Diego
|
|||||
| HOME PEOPLE RESEARCH SOFTWARE PUBLICATIONS JOBS LINKS UCSD CONTACT | |||||
| Overview | Tables & data download | Figures: S1, S2, S3, S4, S5, S6, S7, S8 | Additional Figures: 1, 2, 3, 4, 5 | References | |
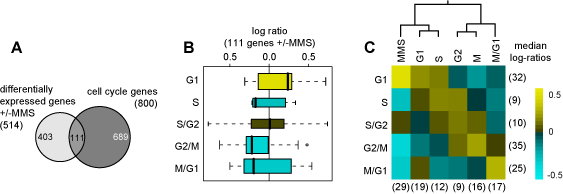
Figure S4. MMS responsive genes implicate G1/S checkpoint | |
|
(A) Approximately 22% of the MMS-responsive genes (111 of 514) have been shown to be temporally regulated during the cell cycle (ref S18).
(B) Distributions of the median log-ratios (over the 27 TF knockouts and wild-type) for genes found to be up-regulated in G1, S, S/G2, G2/M, M/G1. Boxplot colors correspond to the color scale in C.
(C) Clustering these MMS responsive genes with representative profiles from cell cycle phases G1, S, G2, M and M/G1 (ref S18) shows that the MMS profile is most similar to that of late G1 and S phases. Further evidence of G1 and S phase arrest can be found in the expression responses of ACE2 and SWI5, cell cycle regulators expressed in M/G1 phase (ref S18). Both factors are down regulated in response to MMS (Fig. 2a, column T, in the main text), and have contracting binding profiles (Fig. 2b). Moreover, the Ace2 and Swi5 TFs only show significant binding overlap in -MMS (Fig. 3). Together, these findings confirm that exposure to MMS causes cells to progress more slowly through G1/S and S phase (ref S19).
|

|