IDEKER LAB
University of California,San Diego
|
|||||
| HOME PEOPLE RESEARCH SOFTWARE PUBLICATIONS JOBS LINKS UCSD CONTACT | |||||
| Overview | Tables & data download | Figures: S1, S2, S3, S4, S5, S6, S7, S8 | Additional Figures: 1, 2, 3, 4, 5 | References | |
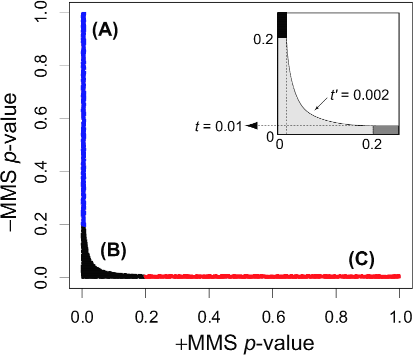
Figure S2. Scoring overlap in TF binding between conditions. | |
|
For a given TF, each gene is assigned a pair of p-values for binding in the presence (+MMS) versus absence (-MMS) of MMS. Genes with p-value pairs that fall into the region (A), (B), or (C) are considered bound in +MMS only, both conditions, or -MMS only, respectively. The inset shows an enlargement of the plot for p-values < 0.25. The regions shown correspond to p-value thresholds of t=0.01 and t'=0.002. The thresholds used in the actual study were t=0.001 and t'=1.5 e -4.
|

|